8 February 2026
Analysis
The Frankenstein Constituency: Why Gorton and Denton Looks Like This
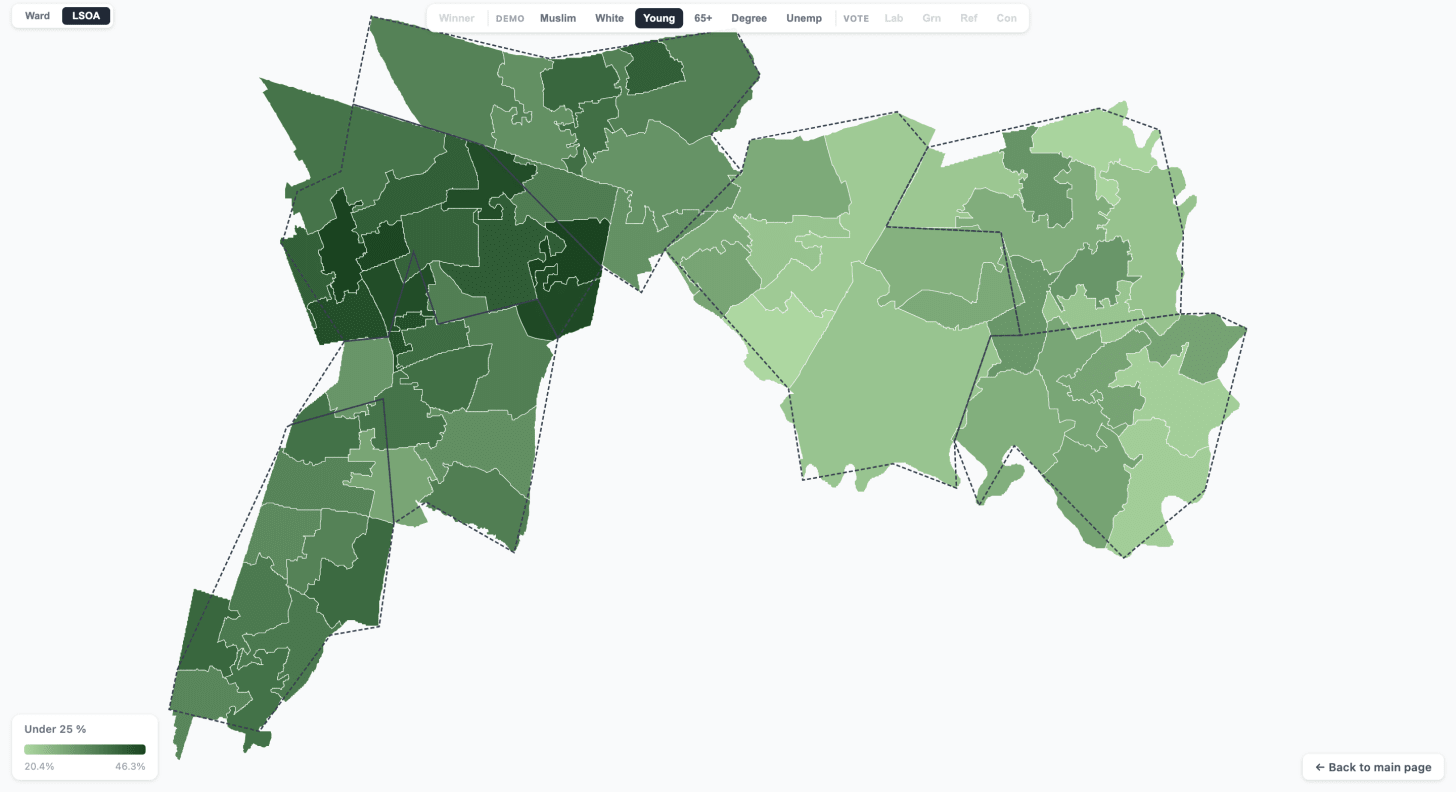
By now, many people have seen the potential Gorton and Denton voting map based on census data, created by Josh Housden and shared on X. This spurred a lot of debate around constituencies makeup, the Boundary Commission, and the very essence of what makes up a constituency. As Luke Tryl noted, this looks like two different constituencies wanting two different thing from an MP.
The full analysis, including detailed charts, methodology, and comprehensive data visualizations, is available on Substack.
Read full article on Substack
Related Analysis
For more polling analysis and seat projections, explore our latest polling trends, use our seat calculator, or browse all articles.
The Frankenstein Constituency: Why Gorton and Denton Looks Like This - Analysis
By now, many people have seen the potential Gorton and Denton voting map based on census data, created by Josh Housden and shared on X. This spurred a lot of debate around constituencies makeup, the Boundary Commission, and the very essence of what makes up a constituency. As Luke Tryl noted, this looks like two different constituencies wanting two different thing from an MP. Subscribe now How did Gorton and Denton come to be? Gorton and Denton was stitched together from the remnants of two abolished seats - Manchester Gorton and Denton and Reddish - with Burnage ward from Manchester Withington thrown in for good measure. It has the fourth-highest index of change in the North West, meaning its electorate has been reshuffled more dramatically than almost any comparable seat. Much of the demographic challenges were covered in my previous article , but to recap, the Manchester wards are 42% white and 40% Muslim, with 42% of residents holding or studying for a degree. The Tameside wards are 83% white, 86% UK-born, and heavily working class. It spans two local authorities, and two competing electorates. The PollCheck interactive constituency map for Gorton and Denton can be used to see the spread of demographics in a heat map Who decides what makes a constituency? Constituency boundaries are drawn by The Boundary Commission for England, an independent, non-partisan body chaired by a High Court judge. It cannot consider voting patterns and is explicitly forbidden from thinking about electoral outcomes. It operates under rules set by the Parliamentary Constituencies Act 1986, most recently amended in 2020. The Commission’s main priority is the 5% rule - every constituency must have an electorate within 5% of the UK-wide electoral quota. For the 2023 review, that quota was 73,393 voters, giving a permitted range of 69,724 to 77,062.
This analysis examines UK political polling trends, seat projections, and election dynamics. PollCheck provides comprehensive coverage of Westminster elections, Scottish Parliament elections, and Welsh Senedd elections, tracking polling data from major UK pollsters including YouGov, Find Out Now, Opinium, More in Common, and others.
Our analysis uses uniform national swing (UNS) methodology to project seat outcomes based on current polling data. We provide free tools including seat calculators, interactive maps, and detailed polling trend visualizations to help understand UK political dynamics.